Análisis fundamental frente a análisis técnico - que será el tema del artículo de hoy.
Si desea invertir como expatriado o particular con un elevado patrimonio neto, que es en lo que estoy especializado, puede enviarme un correo electrónico (advice@adamfayed.com) o WhatsApp (+44-7393-450-837).
Introducción
¿Se ha topado alguna vez con términos como análisis fundamental o análisis técnico? ¿Busca una explicación eficaz para comprenderlos fácilmente?
No te preocupes. Te entiendo. A veces en nuestras vidas, nos encontramos con terminología nueva que es difícil de entender.
Especialmente cuando se es nuevo en el mundo del trading, estos términos pueden crear mucha confusión.
Voy a explicarlos de forma que incluso los principiantes puedan entenderlos.
Así que, si te estás enterando de las palabras que ya conoces, aguanta hasta que llegues a la parte buena.
Comencemos.
Análisis fundamental

¿Qué es el análisis fundamental?
Para los principiantes, el análisis fundamental es el proceso de determinar el valor intrínseco de un valor. Para ello, se examinan los factores financieros y económicos pertinentes.
¿Espera? Has oído algo sobre el valor intrínseco de los títulos, ¿verdad? ¿Qué es el valor intrínseco?
Puede que ya haya oído el término valor, pero para quien no lo sepa, se trata de un instrumento financiero. Los instrumentos o activos financieros son algo que puede comprarse, venderse o negociarse para ganar dinero.
Se pueden considerar acciones, bonos, fondos de inversión, ETF, etc. Como los mejores ejemplos de valores.
Dejando todo eso a un lado, ¿qué es un valor intrínseco? ¿Por qué querría alguien encontrar ese valor intrínseco?
Por valor intrínseco se entiende el valor de un activo o instrumento financiero. Recuerde que el valor de mercado de un activo no es su valor intrínseco.
Sin embargo, si se compara el valor actual con el valor intrínseco, se puede determinar el precio. Respecto a si está sobrevalorado o infravalorado.
En el caso de las acciones o empresas, el valor intrínseco se calcula en función del flujo de caja.
Pero para instrumentos como las opciones, el valor intrínseco es la diferencia entre el precio de ejercicio y el precio actual. Un precio de ejercicio es un precio al que pueden utilizarse las opciones de compra o de venta.
El valor intrínseco también puede denominarse valor razonable o valor justo de mercado.
Volvamos ahora al análisis fundamental.
Ahora entiende que el valor intrínseco depende del valor financiero del activo y del valor actual del mercado. El análisis fundamental permite hallar el valor intrínseco a través de las condiciones actuales del mercado, es decir, las condiciones económicas y financieras.
Con el análisis fundamental, se examina una empresa en su nivel fundamental. Considerando los ratios clave de un activo o instrumento, podemos conocer su salud financiera.
Cuando se habla de acciones, se puede encontrar el valor comercial de una acción en comparación con sus rivales a través del análisis fundamental.
En el análisis fundamental se tienen en cuenta varios factores clave, como:
— Ingresos
— Ganancias
— Crecimiento futuro
— Márgenes de beneficios
— Rendimiento de los fondos propios
Los analistas que utilizan el análisis fundamental se denominan analistas fundamentales. Estos analistas fundamentales pueden hallar el valor del valor a partir de factores macroeconómicos y microeconómicos.
Los factores macroeconómicos son los factores relacionados con la economía. Algunos ejemplos son la inflación, el producto interior bruto (PIB), los tipos de interés, etc.
Los factores microeconómicos se centran mucho más en una población concreta o en decisiones empresariales. La oferta y la demanda, los impuestos, etc., pueden ser buenos ejemplos. El principal objetivo del análisis fundamental es encontrar un valor. Este valor puede compararse con el precio actual para saber si el instrumento o activo está infravalorado o sobrevalorado.
Veamos un ejemplo para ver cómo se considera que un activo está infravalorado o sobrevalorado.
Los analistas fundamentales tratan de encontrar acciones que se negocien a precios superiores o inferiores a su valor real. Si el valor justo de mercado es superior al precio de mercado de la acción, se dice que está infravalorada.
Al mismo tiempo, si el valor razonable es inferior al precio de mercado, se dice que está sobrevalorado. Las acciones infravaloradas se consideran las mejores para comprar y las sobrevaloradas se recomienda venderlas.
El análisis fundamental, en general, se realiza desde una perspectiva macroeconómica hasta una perspectiva microeconómica. Esto ayudará a los analistas a encontrar los activos que no tienen un precio correcto según el mercado.
Esto comienza con las condiciones económicas, como el bienestar de la economía.
A continuación, el siguiente paso consiste en centrarse en el sector específico correspondiente al instrumento o activo.
Por último, se trata de la situación financiera del activo concreto. Por ejemplo, la situación financiera de la empresa emisora de acciones.
De este modo, se determina el valor justo de mercado de un activo. Sin embargo, hay muchas formas de calcular el valor intrínseco de las acciones. En el caso de instrumentos como las opciones, se utiliza un cálculo estándar.
¿Cómo se hace?
Los datos financieros disponibles públicamente se utilizan para hallar el valor de un activo con el análisis fundamental.
Estos datos pueden obtenerse a través de los estados financieros, los informes anuales y los archivos.
En Estados Unidos, las empresas están obligadas a presentar informes a la SEC (Security Exchange Commission). Si está en Estados Unidos, hay tres formularios importantes que debe conocer.
• Formulario 10-K
• Formulario 10-Q
• Formulario 8-K
10-k es un informe anual, 10-Q es una declaración trimestral y 8-K se refiere a los principales acontecimientos que tienen lugar en una empresa.
¿Dónde se puede encontrar esta información pública sobre una empresa? Casi todas las empresas facilitan estos datos en sus sitios web (secciones de relación con los inversores).
Importancia de los beneficios
Entre todos los datos que se tienen en cuenta durante el análisis fundamental, los beneficios de una empresa desempeñan un papel fundamental.
En palabras sencillas, debes tratar de encontrar los detalles de los ingresos de la empresa. Además, averigua cuánto más puede ganar en el futuro.
Los beneficios, como usted sabe, son las ganancias obtenidas por una empresa. Pueden ser difíciles de calcular. Pero los informes, de los que hemos hablado antes, nos ayudan a hacerlo.
Si ve que una empresa va bien, puede esperar una subida del valor de sus acciones.
No obstante, las empresas que ofrecen dividendos podrían aumentar sus dividendos.
En tal escenario, es posible que no se observe una mejora significativa de los beneficios de la empresa. Esto puede provocar una disminución del valor de las acciones.
Herramientas
Por el ejemplo anterior, es posible que haya comprendido que los beneficios no lo son todo para el análisis fundamental.
Existen otras herramientas eficaces que le ayudan a determinar cómo valora el mercado una acción. Por herramientas me refiero a ratios.
La mayoría de los sitios web de finanzas ya disponen de toda la información relacionada con estos ratios.
Sin embargo, no es demasiado difícil hacerlo por uno mismo si se lo propone. Veamos algunas de las herramientas de análisis fundamental más importantes.
Beneficios por acción (BPA)
No se puede averiguar mucho sobre una empresa limitándose a conocer los beneficios o las acciones.
La combinación de ambos le proporcionará un ratio de uso frecuente para el análisis fundamental.
Esto se conoce como BPA (beneficio por acción) y nos permite saber cuánto beneficio se asigna a cada acción.
Para calcular el BPA, tendrá que dividir los ingresos netos por el número de acciones en circulación. Al hacerlo, no debes incluir los dividendos de una acción preferente en los ingresos netos.
Relación precio/beneficios (PER)
Habría sido mucho más fácil de entender si se hubiera escrito como P/EPS.
Es la relación entre el precio actual de la acción de una empresa y sus beneficios por acción.
Crecimiento precio/beneficios (PEG)
Se refiere a la anticipación de la tasa de crecimiento de los beneficios de una acción durante un periodo de un año.
Relación precio/ventas (P/V)
Es la relación entre el precio de las acciones de una empresa y sus ingresos. A veces, P/S también se conoce como múltiplo de ventas, múltiplo de ingresos o PSR.
Relación precio/valor contable (P/B) o relación precio/capital:
Este ratio establece una comparación entre el valor contable de una acción y su valor de mercado.
Se calcula dividiendo el precio de cierre reciente de una acción por el valor contable de la acción del trimestre anterior.
El valor contable es el coste de un activo excluyendo la depreciación acumulada.
Ratio de reparto de dividendos
Se trata de una comparación entre los dividendos a los accionistas y los ingresos netos de la empresa.
Rendimiento de los dividendos
El total anual de dividendos comparado con el precio de la acción se conoce como rentabilidad por dividendo.
Para calcularlo, hay que dividir los pagos de dividendos por acción en un año por el valor de una acción.
Rendimiento de los fondos propios
El rendimiento de los fondos propios se obtiene dividiendo los ingresos netos de la empresa entre los fondos propios de los accionistas. También se denomina rendimiento del patrimonio neto de la empresa.
Eso es casi todo lo que se necesita para tener una comprensión completa del análisis fundamental.
Veamos ahora en detalle el análisis técnico.
Análisis técnico
Hemos hablado del análisis fundamental. También hemos hablado de cómo ayuda de varias maneras a determinar si un activo es una compra o una venta.
Ahora hablaremos de otra forma de determinar la posición de compra o venta de un activo. Se trata del Análisis Técnico.
Para que resulte muy sencillo de entender, el análisis técnico consiste en investigar los movimientos pasados. El objetivo de investigar los movimientos pasados de los precios es hacer una predicción sobre los movimientos futuros de los precios.
Charles Dow es la persona que creó el concepto de análisis técnico. ¿No lo reconoce? Resulta que es el fundador del índice industrial Dow Jones y de The Wall Street Journal.
El análisis fundamental es el que se realiza teniendo en cuenta la dinámica empresarial, como la estructura del negocio. Por otro lado, el análisis técnico utiliza datos de precios y volúmenes para anticipar precios futuros.
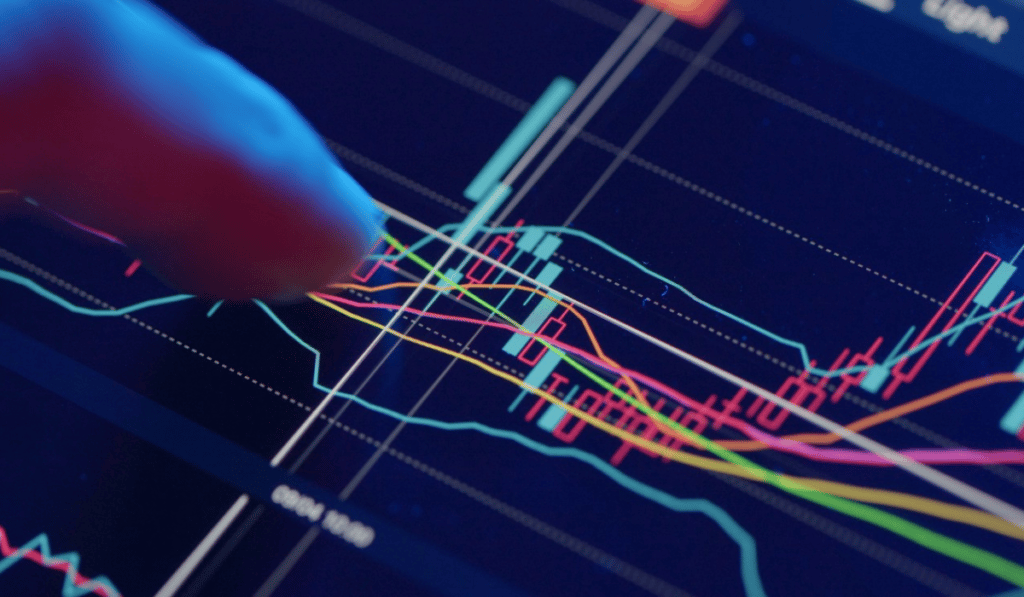
El análisis técnico utiliza distintos tipos de gráficos de precios para analizar el precio y el volumen. Tras el análisis, se obtienen indicadores técnicos que predicen si se trata de una compra o una venta.
El primer concepto en el que se basa el análisis técnico es que las acciones del mercado son las responsables de todo. Esto representa que el precio de una acción refleja la información de su valor.
Cuando ocurre algo nuevo que pueda afectar al valor de una acción, el mercado lo capta y lo refleja en el precio de la acción. Otro concepto del análisis técnico es que los precios actúan de acuerdo con las tendencias.
Esto significa que los precios seguirán moviéndose en una dirección determinada hasta que un indicador técnico sugiera lo contrario. Hay varios indicadores técnicos disponibles, y el que se elija depende del inversor.
El concepto consiste en reconocer y seguir una tendencia hasta que haya una señal de inversión. Si el precio está subiendo y un indicador técnico sugiere una caída, entonces un inversor analista técnico lo venderá.
Otro concepto importante del análisis técnico es que los patrones históricos se repiten. Me refiero a los patrones históricos que están relacionados con los movimientos de precios de un activo. Este concepto se centra en la psicología del mercado para determinar las pautas de los precios.
La psicología del mercado se refiere al sentimiento que sienten todos los inversores. Los precios de los valores dependen de este sentimiento del mercado, en lo que respecta a las subidas y bajadas. Una vez conocido el análisis técnico, sepamos qué significan los indicadores técnicos.
Indicadores técnicos
Los indicadores técnicos son para el análisis técnico lo mismo que las herramientas de análisis fundamental son para el análisis fundamental.
En palabras sencillas, son las señales basadas en el precio, el volumen y el interés de un valor.
Los indicadores técnicos son utilizados por los analistas técnicos, también llamados chartistas o técnicos.
Estos técnicos utilizan estos indicadores para analizar los movimientos del precio de un activo.
A continuación se indican los términos más comunes de los indicadores técnicos que oirá a menudo.
Índice de flujos monetarios
El Índice de Flujo Monetario (IFM) es un indicador utilizado para calcular el estado de compra o venta de un activo.
Realiza el análisis en función del tiempo y del precio de ese valor.
El índice de flujo monetario también puede denominarse RSI ponderado por volumen. ¿Qué es el RSI? Llegaremos a eso.
El índice IMF suele oscilar entre 0 y 100 puntos. Cuando el IMF aumenta, entonces se considera una señal de que la presión compradora de ese activo está aumentando.
Mientras que una oscilación negativa del IMF significaría, por lo general, que la presión vendedora está aumentando.
Un IMF superior a 80 significa una situación de sobrecompra, mientras que por debajo de 20 significaría una condición de sobreventa.
Las condiciones de sobrecompra representan un pronto descenso y las de sobreventa predicen una subida.
Divergencia de convergencia de medias móviles (MACD)
Este indicador ayuda al operador a identificar la dirección de una tendencia y su impulso.
Si el MACD es superior a cero, se espera que el precio aumente, y viceversa.
Este indicador consta de dos líneas, que son una línea MACD y una línea de señal.
Si el MACD cae por debajo de la línea de señal, el precio de un valor está bajando. Si se sitúa por encima de la línea de señal, el precio está subiendo.
Índice de fuerza relativa (RSI)
Al igual que el IMF, el RSI también se mueve entre 0 y 100. Este indicador se utiliza para marcar las recientes ganancias de precios frente a las recientes pérdidas de precios.
El RSI se utiliza para determinar la condición de sobrecompra y sobreventa.
Si el RSI está por debajo de 30, está sobrevendido, y si está por encima de 70, está sobrecomprado.
Las condiciones de sobrecompra significan que el activo podría bajar y las de sobreventa indican una subida.
¿Recuerda que dijimos que el IMF también se puede decir como RSI ponderado por volumen, verdad? Eso es porque el IMF también se concentra en el volumen.
Volumen medio
Se refiere a la media móvil simple del número de acciones negociadas en un periodo determinado.
Si el volumen reciente es superior al volumen medio móvil, indica una mayor fortaleza de la tendencia.
Esto indicaría al operador una condición de compra. De todos modos, si el volumen reciente es inferior a la media móvil, entonces indica una venta.
Bandas de Bollinger
Las bandas de Bollinger también se utilizan para determinar las condiciones de sobrecompra y sobreventa.
Habrá tres bandas en este indicador, que son la banda superior, la banda media y la banda inferior.
La banda superior representa una señal positiva, mientras que la banda inferior representa una señal negativa.
La banda media es la media móvil simple de un periodo de 20 días.
Si la banda media sigue tocando la banda superior, entonces indica una condición de sobrecompra.
Si la banda media sigue tocando la banda inferior, entonces indica una condición de sobreventa.
Volumen en balance
Este indicador se utiliza para medir el flujo positivo y negativo de volumen de un valor en un tiempo determinado.
El indicador se basa en un total del volumen que subió menos el volumen que bajó.
El volumen que subió es el volumen de un activo cuando su precio subió.
El volumen que bajó es el volumen de un activo cuando bajó su precio.
El volumen se añade a este indicador cuando se produce una subida del precio de un valor. El volumen se resta cuando se produce un descenso.
Si el OBV aumenta, indica que los compradores están entusiasmados con el valor.
Del mismo modo, cuando el OBV disminuye, los operadores no están demasiado interesados en ese valor.
Línea de acumulación/distribución
Este indicador se utiliza para calcular el flujo de dinero, tanto si entra como si sale de un valor.
La línea A/D es algo similar a la OBV, pero hay una diferencia importante. La diferencia es que el rango de negociación también se tiene en cuenta junto con el precio de cierre.
Si la línea A/D muestra una tendencia alcista, significa que los compradores están más interesados. Esto se denomina tendencia alcista.
Si la línea A/D muestra una tendencia bajista, significa que los operadores están vendiendo. Esto se denomina tendencia bajista.
Índice Direccional Medio (ADX)
Este indicador se utiliza para calcular la fuerza y el impulso de una tendencia. Si el ADX es superior a 40, entonces hay margen para mucha fuerza direccional.
Puede ser al alza o a la baja. Que suba o baje dependerá de la dirección en la que se mueva el precio.
Si el ADX es inferior a 20, se dice que la tendencia es débil o no tendencial.
Conclusión
Ahora también conoce el análisis técnico. Las herramientas de análisis fundamental o los indicadores técnicos pueden haber sido un poco difíciles de entender.
Sin embargo, espero que haya podido entender fácilmente las principales definiciones.
El análisis fundamental lo utilizan sobre todo las personas que optan por una inversión a largo plazo.
Por otra parte, se dice que el análisis técnico favorece a quienes se dedican a las inversiones a corto plazo.
Cada uno tiene su importancia. Hay personas que creen en un concepto y están totalmente en contra del otro.
No quiero entrar en la conversación porque sería ofensivo para quienes piensan de otro modo.
El principal objetivo de este artículo es proporcionar información educativa más que elegir un ganador.
Dicho esto, espero que haya podido comprender estos temas de forma detallada.
Si usted es un principiante, entonces no es prudente comenzar a operar/invertir sólo aprendiendo esta información.
Invertir es un proceso que requiere mucha concentración, tiempo y esfuerzo. Especialmente cuando se trata de inversiones arriesgadas, es probable que se pierda dinero.
Por lo tanto, antes de involucrarse en el proceso de inversión, recomiendo buscar asesoramiento sobre inversiones.
Un experto financiero le guiará por el camino correcto para que pueda tener una próspera carrera financiera.
¿Busca a alguien que pueda ocuparse eficazmente de sus necesidades de inversión?
¿Necesita un planificador financiero o un gestor de patrimonios que se ocupe de sus necesidades?
No se preocupe. Puedo ayudarle. He ayudado a muchas personas con dificultades económicas.
Especialmente aquellos que querían alcanzar la libertad financiera superando las dificultades económicas.
Si usted también necesita servicios similares, no dude en ponerse en contacto conmigo.
¿Le duele la indecisión financiera? ¿Quiere invertir con Adam?

Adam es un autor reconocido internacionalmente en temas financieros, con más de 830 millones de respuestas en Quora, un libro muy vendido en Amazon y colaborador de Forbes.