As I said on a previous article, you’re probably hoarding too much and you can likely spend more in retirement than you think.
That is, if you want to retire at a conventional age. If you want to retire young, and achieve financial independence and retire early (FIRE), the situation is entirely different.
In this case, many people need to be more cautious when it comes to withdrawal rates.
I have helped countless people (usually expats and high-net-worth individuals) with their investments and financial matters. That includes retirement planning, and I have written about the subject for various media organizations.
If you're an expat or high-net-worth individual who wants a second opinion on your retirement strategy, I offer a complimentary, no-obligation assessment. You can learn more or get in touch here.
In that time, I have seen two cases over and over again:
- People being too cautious about their withdrawals in retirement. This is true for most older retirees. They could spend more.
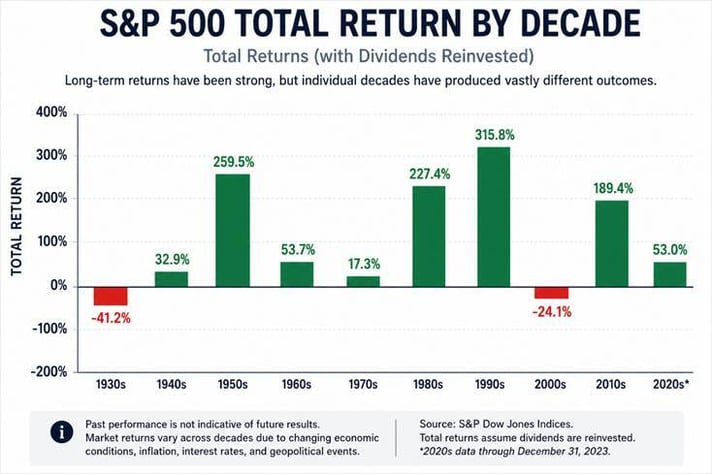
- Then there is a smaller number of people who are younger and want to achieve FIRE who need to be more conservative. This is especially the case because the stock market tends to have lost decades and severe downturns periodically. This isn’t a problem if you aren’t retired, but it can become an issue if you are.
Firstly, let me explain why these two situations are so different.
If you retire at a standard age (60s or early 70s these days), you have three phases of retirement:
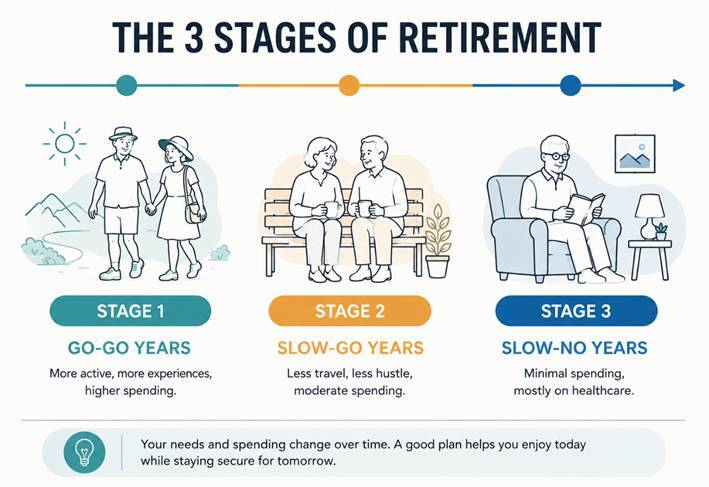
Stage one is when you are, usually, healthy enough to travel, do the things you want etc.
Stage two, and especially stage three, don’t require the same levels of withdrawal for most people.
This means that you can probably spend much more than 4% a year when you are healthy provided you are invested in a diversified portfolio. Later on, when your health or willingness to travel and go out declines, you can spend less.
But if you aim to retire in your 30s or 40s, you might be alive for seventy years, with the lion’s share of those years likely to be healthy ones.
That is likely why you want to retire young, but it also means you need to be careful about two things: what you invest in, and your withdrawal rates.
Why the 4% rule and FIRE might not work
Let’s look at the latter issue first, what you invest in. Imagine you retired in late 1999 or early 2000. The world was full of optimism at the turn of the millennium.
Then the big 2000 crash happened. Just as the stock market recovered, it crashed again in 2008. The S&P 500 didn’t recover until 2011, and the Nasdaq took until 2015-2016 to hit its 2000 high.
In that situation, you would have only $50,000 left if you had withdrawn 4% from your portfolio and adjusted that withdrawal rate for inflation.
|
Year |
Withdrawal |
Year-end balance |
In 2000 dollars (inflation adjusted) |
|
2000 |
$40,000 |
$872,640 |
$843,946 |
|
2002 |
$42,518 |
$537,450 |
$497,657 |
|
2007 |
$48,430 |
$674,314 |
$541,771 |
|
2008 |
$49,786 |
$393,453 |
$304,543 |
|
2013 |
$55,101 |
$449,126 |
$321,218 |
|
2021 |
$62,061 |
$343,953 |
$211,735 |
|
2022 |
$64,978 |
$228,453 |
$130,216 |
|
2024 |
$73,054 |
$158,567 |
$84,376 |
|
2025 |
$75,172 |
$98,323 |
$50,845 |
Clearly, that person is likely to run out of money soon.
Now let’s look at somebody who invests 80% in stocks via the S&P 500 and 20% in government bonds. This makes a huge difference as per the graph below, but the person would still be in danger of running out in the coming years.
Ultimately, $1 million became $641,000 in 2022 and is now worth $765,000, but that is only $395,639 in 2000 money terms.
|
Year |
Withdrawal |
Year-end balance |
In 2000 dollars |
|
2002 |
$42,518 |
$641,558 |
$594,058 |
|
2008 |
$49,786 |
$530,355 |
$410,509 |
|
2013 |
$55,101 |
$668,682 |
$478,246 |
|
2021 |
$62,061 |
$826,082 |
$508,530 |
|
2022 |
$64,978 |
$631,031 |
$359,683 |
|
2025 |
$75,172 |
$765,088 |
$395,639 |
Being 60% in the S&P 500 and 40% in bonds makes a much bigger difference. Now you have $1,052,145, which is $544,000 in 2000 purchasing power parity terms.
You can see that this person with the 60%/40% portfolio is likely to have proven the 4% rule right - by 2030, he or she will likely not run out of money in retirement, which is in line with the original idea before the 4% rule that it could ensure you don’t run out within 30 years.
Yet we can clearly see that a person who has lost almost half of their purchasing power is in danger of running out of money if their retirement will last for forty or fifty years.
So how do you solve this issue?
Firstly, you can’t solve this issue by being in conservative assets.
The graph below looks at investing 20% in stocks and 80% in bonds:
|
Year |
Withdrawal |
Year-end balance |
In 2000 dollars |
|
2002 |
$42,518 |
$1,028,763 |
$952,594 |
|
2008 |
$49,786 |
$1,032,010 |
$798,803 |
|
2014 |
$55,928 |
$1,171,244 |
$824,489 |
|
2020 |
$61,325 |
$1,179,690 |
$760,340 |
|
2022 |
$64,978 |
$948,297 |
$540,523 |
|
2025 |
$75,172 |
$950,155 |
$491,340 |
This 20%/80% portfolio outperformed a 100% stocks portfolio but underperformed a 50%/50% or 60%/40% portfolio based on an original $1 million invested in 2000 as per the graph below:
|
Allocation |
Worst nominal drawdown |
Year of lowest real balance |
End 2025 real |
|
100/0 |
severe |
2025 |
$50,845 |
|
60/40 |
31.6% |
2022 |
$544,082 |
|
50/50 |
~24% |
2022 |
$564,393 |
|
20/80 |
20.0% |
2025 |
$491,340 |
100% invested in cash performs even worse. The scenario below looks at somebody who has $1 million and puts it in the bank. It is US-centric but the same fundamentals apply to other developed markets:
|
Year |
Rate |
Inflation |
Real rate |
Withdrawal |
End balance |
Real balance |
|
2000 |
6.24% |
3.4% |
2.7% |
$40,000 |
$1,019,904 |
$986,368 |
|
2003 |
1.13% |
2.3% |
-1.1% |
$43,198 |
$957,763 |
$866,912 |
|
2007 |
5.02% |
2.8% |
2.2% |
$48,430 |
$899,153 |
$722,415 |
|
2011 |
0.10% |
3.2% |
-3.0% |
$52,295 |
$713,622 |
$528,921 |
|
2015 |
0.13% |
0.1% |
0.0% |
$56,823 |
$494,528 |
$347,772 |
|
2019 |
2.16% |
1.8% |
0.4% |
$60,241 |
$278,348 |
$181,555 |
|
2021 |
0.08% |
4.7% |
-4.4% |
$62,061 |
$155,911 |
$95,978 |
|
2022 |
1.68% |
8.0% |
-5.9% |
$64,978 |
$92,461 |
$52,702 |
|
2023 |
5.02% |
4.1% |
0.9% |
$70,176 |
$23,403 |
$12,814 |
|
2024 |
— |
— |
— |
needs $73,054, has $23,403 |
$0 |
$0 |
What makes the situation worse is that since 2008 interest rates have been lower, so a cash-only strategy is likely to work out even worse in the future!
So, what worked best if we back test from 2000?
Broader diversification works best. This means a combination of bonds, cash, stocks, and alternative assets.
Let’s look at Harry Browne’s Permanent portfolio, which is split evenly between cash, bonds, stocks, and gold.
Gold, bonds, and cash might not have come close to beating stocks long-term, but they helped maintain this portfolio’s value because it evened out the volatility.
|
Year |
Port. return |
Withdrawal |
End balance |
Real balance |
|
2000 |
0.8% |
$40,000 |
$968,088 |
$936,255 |
|
2002 |
3.7% |
$42,518 |
$923,610 |
$855,227 |
|
2008 |
-6.0% |
$49,786 |
$1,062,377 |
$822,308 |
|
2013 |
0.5% |
$55,101 |
$1,230,361 |
$879,962 |
|
2020 |
12.7% |
$61,325 |
$1,325,602 |
$854,384 |
|
2022 |
-7.4% |
$64,978 |
$1,178,724 |
$671,865 |
|
2025 |
22.4% |
$75,172 |
$1,554,805 |
$804,015 |
Ray Dalio’s All Weather Portfolio (30% US stocks, 40% long Treasuries, 15% intermediate Treasuries, 7.5% gold, 7.5% commodities) does even better:
|
Year |
Port. return |
Withdrawal |
End balance |
Real balance |
|
2000 |
9.4% |
$40,000 |
$1,049,904 |
$1,015,381 |
|
2002 |
5.8% |
$42,518 |
$998,516 |
$924,587 |
|
2008 |
2.8% |
$49,786 |
$1,249,478 |
$967,129 |
|
2011 |
16.2% |
$52,295 |
$1,467,707 |
$1,087,834 |
|
2020 |
15.9% |
$61,325 |
$1,988,979 |
$1,281,948 |
|
2021 |
8.0% |
$62,061 |
$2,081,881 |
$1,281,591 |
|
2022 |
-19.0% |
$64,978 |
$1,633,560 |
$931,118 |
|
2025 |
13.4% |
$75,172 |
$1,907,088 |
$986,186 |
But you can see that even this portfolio isn’t perfect. Government bonds got hammered in 2022, which explains the -19% return.
In the modern world, clients who have access to financial advisors and wealth managers would be best placed to also look at alternative assets such as hedge funds, which go hand in hand with some of these assets.
For instance, if you would have added 40% in a hedge fund like Millennium, the results would have been even better.
|
Portfolio allocation: 30% S&P 500 | 40% Millennium | 15% Intermediate Treasuries | 7.5% Commodities | 7.5% Gold |
||||
|
Year |
Portfolio Return |
Withdrawal |
End Balance |
Real Balance |
|
2000 |
+7.4% |
$40,000 |
$1,030,704 |
$996,812 |
|
2002 |
+2.3% |
$42,518 |
$991,006 |
$917,633 |
|
2008 |
−11.8% |
$49,786 |
$1,185,176 |
$917,358 |
|
2013 |
+11.1% |
$55,101 |
$1,677,848 |
$1,200,007 |
|
2020 |
+19.0% |
$61,325 |
$2,424,916 |
$1,562,920 |
|
2022 |
−1.6% |
$64,978 |
$2,618,246 |
$1,492,383 |
|
2025 |
+15.4% |
$75,172 |
$3,664,715 |
$1,895,084 |
How about lowering your withdrawal rates?
A second way you can reduce risk is to lower your withdrawal rate. If you keep to a 3%–3.5% withdrawal rate, the math changes completely.
The graphs below look at a 60%/40% portfolio, with 3% and 3.5% withdrawal rates. Again, the calculations begin in 2000, but only results from 2002 onward are shown due to space limitations.
3.0% ($30,000 in year one from a million-dollar portfolio)
|
Year |
Withdrawal |
End balance |
Real balance |
|
2002 |
$31,889 |
$785,095 |
$726,967 |
|
2008 |
$37,339 |
$786,320 |
$608,632 |
|
2013 |
$41,326 |
$1,144,365 |
$818,457 |
|
2020 |
$45,994 |
$1,688,305 |
$1,088,155 |
|
2022 |
$48,734 |
$1,565,900 |
$892,552 |
|
2025 |
$56,379 |
$2,208,111 |
$1,141,850 |
3.5% ($35,000 in year one)
|
Year |
Withdrawal |
End balance |
Real balance |
|
2002 |
$37,203 |
$771,411 |
$714,297 |
|
2008 |
$43,563 |
$735,223 |
$569,082 |
|
2013 |
$48,214 |
$1,003,648 |
$717,816 |
|
2020 |
$53,660 |
$1,345,704 |
$867,341 |
|
2022 |
$56,856 |
$1,216,185 |
$693,217 |
|
2025 |
$65,776 |
$1,630,128 |
$842,966 |
So, what’s the bottom line?
The kinds of assets that don’t outperform long-term, such as commodities, gold, bonds and cash, can play a role in retirement planning.
Whilst stocks outperform most other assets long-term, they can have lost decades. The US stock market is arguably due for another period of muted returns. Cash and government bonds pay less than they historically have.
That means focusing on broader diversification for your assets is key if you want to achieve FIRE and make your money last.